## Azure Networking To troubleshoot a network issue, it's essential to understand the network topology first - how the network components are structured and connected. e.g., virtual networks/subnets layouts, routing paths, and any network security or connectivity components involved. When raise a ticket to Azure support, it's recommended to provide the Resource ID of both ssource and target if the connection establishes within Azure. - How to get the resource ID: Open the target resource in the Azure Portal → go to the "Overview" blade → click the "JSON view" link on the right-hand side → copy the the Resource ID. Example: `/subscriptions/<subID>/resourceGroups/<rgName>/providers/<provider>/<type>/<resourceName>` ### CIDR - The most commonly used subnet block size when creating a subnet in an Azure Virtual Network (VNet) is **/24** (which provides **256** IP addresses, with 251 usable for most workloads after Azure reserves 5 for internal use). This size is widely recommended for general-purpose workloads and allows for future growth and scaling. - /25= 128 IPs, /26 = 64 IPs, /27 = 32 IPs, /28 = 16 IPs, /29 = 8 IPs (smallest supported size in Azure) ## Useful command - WindowsでのDNSキャッシュの確認と消去方法 ```powershell ipconfig /displaydns ipconfig /flushdns ``` - TCP/TNC エンド ツー エンド のネットワーク遅延を確認する場合、クライアント環境によって利用できるツールがあります。 例えば、リアルタイムでPowerShellの「Test-NetConnection」とLinux環境の「telnet」など ```powershell Test-NetConnection xxxx.database.windows.net -Port 1433 -InformationLevel Detailed nc -zv 0.0.0.0 1433 telnet xxxx.database.windows.net 1433 curl -v telnet:xxxx.database.windows.net:1433 curl -v telnet://xxxx.database.windows.net:1433 Resolve-DnsName microsoft.com nslookup xxxx.database.windows.net ``` SQL-Connectivity-checker/SSMS/SQLCMD/Azure Query Editor - Latency ```bash # A buffer size is required to perform a TCP latency test. This example measures the round trip latency of sending an 8KB packet to the target server, printing a histogram with 100 buckets when completed: psping -l 8k -n 10000 -h 100 192.168.2.2:5000 time nc -zw30 lab-sql-single.database.windows.net 1433 • -z: This flag tells Netcat to scan for listening daemons without sending any data to them. It's often used for checking if a service is available and listening on a given port. -w30: This option sets the timeout for connections to 30 seconds. If the connection cannot be established within this time frame, Netcat will exit. ``` ## Useful link - Check whether [MicrosoftIPs](https://csstoolkit.azurewebsites.net/(S(ujxys54cucd4yhjzcfyg2hfn))/Home/MicrosoftIPs) - [microsoft/CSS_SQL_Networking_Tools: Tools used by the SQL Networking Customer Support Team](https://github.com/microsoft/CSS_SQL_Networking_Tools) ## Capture network trace ### Netsh Run powershell/cmd as Administartor [Refer Netsh Commands for Network Trace | Microsoft Learn](https://learn.microsoft.com/en-us/previous-versions/windows/it-pro/windows-server-2012-r2-and-2012/jj129382%28v=ws.11%29) ```powershell # start the trace # scenario InternetClient_dbg can get more detailed logs than Internetclient. # Caps the trace size at ~3 GB to avoid filling the disk. netsh trace start capture=yes tracefile=C:\NETTRACE_DEBUG.ETL scenario=InternetClient_dbg maxsize=3072 overwrite=yes # Now reproduce the same 10060 error via SSMS # stop the trace netsh trace stop # Analyze the trace # You can use netmon to analyze the files captured by netsh command. If you want to analyze the .etl file using WireShark directly, you need to convert the .etl file to a .pcapng file or open it with netmon first and save to a .pcapng file. To download the etl2pcapng executeable:https://github.com/microsoft/etl2pcapng/releases ``` ### TCPdump TCPdump: `sudo tcpdump -s0 -i any -n -w outfile.pcap` - https://learn.microsoft.com/en-us/troubleshoot/azure/azure-kubernetes/logs/packet-capture-pod-level - https://learn.microsoft.com/en-us/troubleshoot/azure/azure-kubernetes/logs/capture-tcp-dump-linux-node-aks ProcDump - https://github.com/microsoft/ProcDump-for-Linux ### Wireshark - Convert etl file to cap: open with Network Monitor and save it as cap. <Capture network trace by Wireshark> https://www.wireshark.org/download.html - Menu[Capture] -> [Options]: select correct network interface (usually Ethernet or the primary network adapter). - Menu[Capture] -> [Start]: start capture and reproduce the connectivity issue. - Menu[Capture] -> [Stop]: stop capture. - Menu[File] -> [Save As]: save as a .pcap file for analysis. Filter on IP: ip.addr == 0.0.0.0 port 1433 #### Analyze traces Review network trace *cap file View -> Time Display Format ##### Useful filters: ``` ip.dst == 1.2.3.4 or ip.src == 1.2.3.4 tcp.sream eq 71 ``` ##### Useful columns: - Stream index - a unique tcp.stream number to identify which packets belong to the same TCP conversation (flow). How to display: 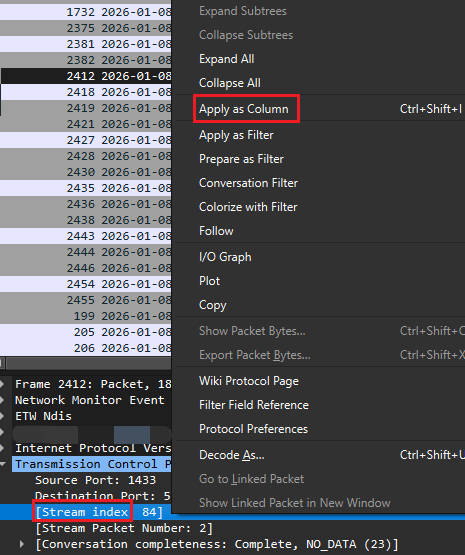 ### How to select interface in wireshark If the connection is active, we can identify the correct network adapter by comparing the Local address used by the connection with the IPv4 address of the NIC. For example, connect to SQL Server then run the following command to check the local address. ```powershell # check LocalAddress Get-NetTCPConnection | Where-Object { $_.RemotePort -eq 1433 } # Output shows LocalAddress, LocalPort, RemoteAddress, RemotePort, etc. # Alternative using netstat netstat -ano | findstr :1433 ``` Next, run `ipconfig /all` to list all NIC and compare the IPv4 Address with the local address. Note that sometimes the NIC listed in wireshark does not appear in ipconfig. In that case, we can try `Get-NetIPAddress | Select-Object InterfaceAlias, IPAddress` - Why the same interface in wireshark is not shown in ipconfig? "Local Area Connection" is a virtual NIC based on the NDIS filter driver created by a VPN client or security software, which may not be recognized by the standard network API of Windows. Get-NetIPAddress only displays interfaces that are officially registered with the OS, so there are no Wireshark-specific capture adapters or special virtual NICs. WAN Miniport is a driver for a virtual network adapter built into the Windows OS that is used to provide specialized network functions such as VPN and tunnel connections rather than physical NICs. <Wireshark Interface management>You can learn more about it here. 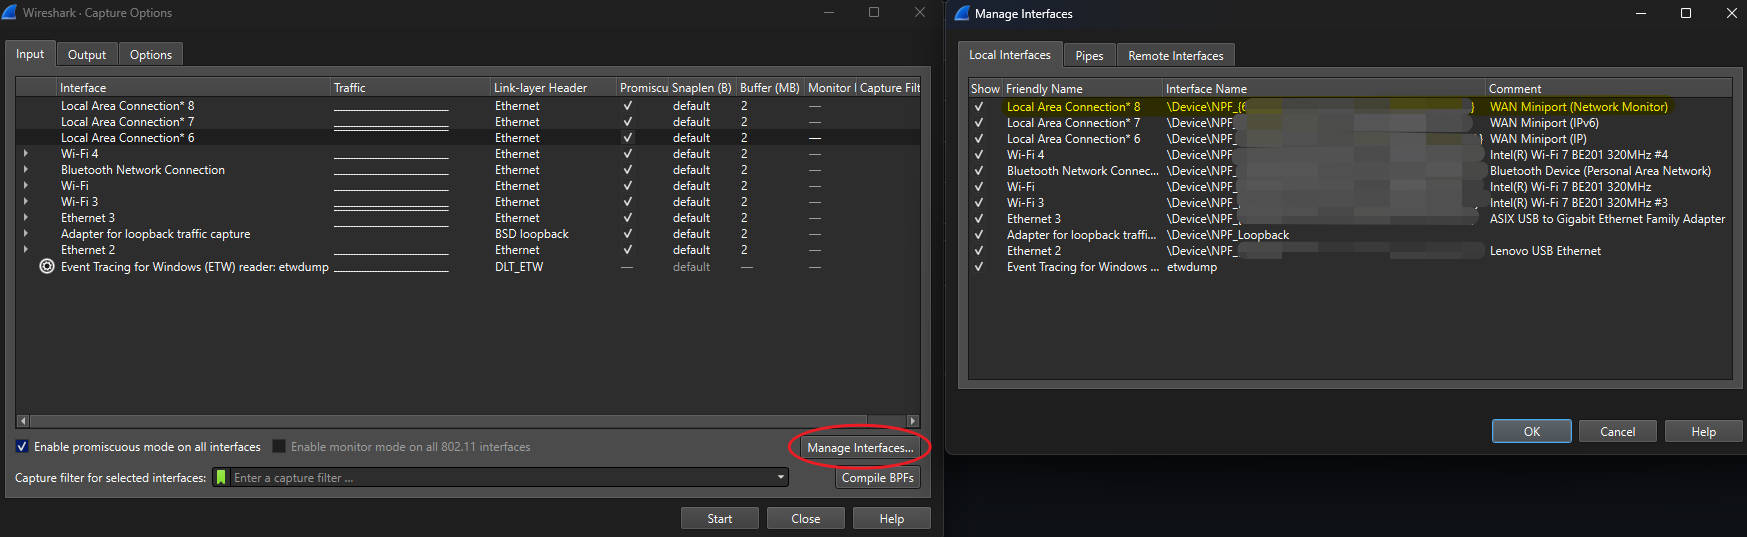 On Wireshark, VPN adapters may appear as “Local Area Connection *xx”. Because PPP‑based VPNs create a **temporary virtual network adapter** each time the VPN connects, the interface number can change between sessions. The most reliable way to identify the correct interface is to generate traffic (for example, ping or connect to a server) and observe which interface shows an increase in packets.